
Duane and I have been looking at, analyzing, and trying to come to terms with our IAR test scores since they came out in the fall, and even though we have a few interesting things to add to the conversation (hopefully, but you be the judge), we had pretty much decided NOT to write another article detailing how bad the test scores are in District 61. What’s the point (we thought). From our analysis of the data, we came up with three interesting items which we felt would be best to incorporate into future articles, but we decided to leave a broader analysis of the scores out. Well, until the board meeting earlier this week, that is. The naivete of a few of the board members regarding our standardized test scores during the discussion of our district Fastbridge scores gave us pause. OK, naivete might be a little strong, but the mood when discussing DPS standardized test should be somber at best; and would I be wrong to say that I heard uneasy giddiness in the Fastbridge testing questions at times? Our feeling is that whenever DPS scores are discussed, the conversation should turn immediately to: “holy shit! are you kidding me?” and “let’s drop everything right now – board training, solar panels1, etc. – and focus on the kids!”. But since we didn’t hear those comments during the discussion, we wonder at what point the board will decide to take action. What does it take? Maybe this...
There’s a growing group in the U.S. (Freddie deBoer, et al.) that believes that student achievement is-what-it-is and there isn’t much a public school district is going to do about it. I have sympathy for this opinion, I really do. Duane and I talk about that all the time – what can we do when learning is not a priority in many households. But before we give up, let’s look at another chart…
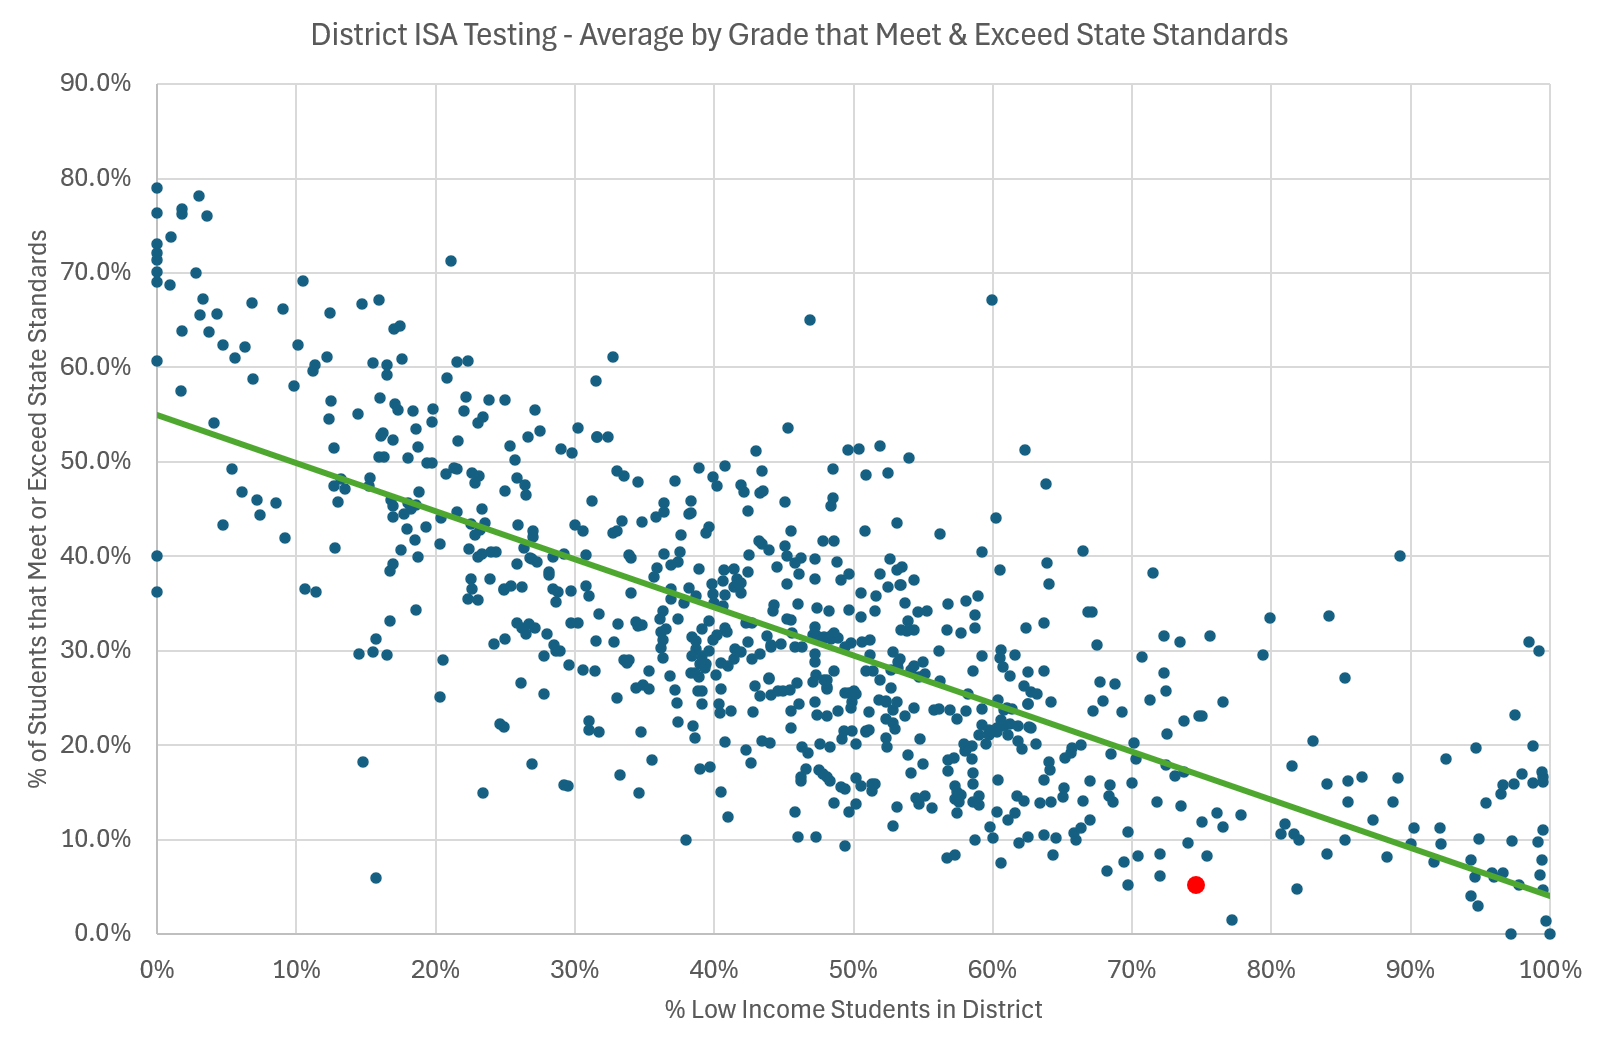
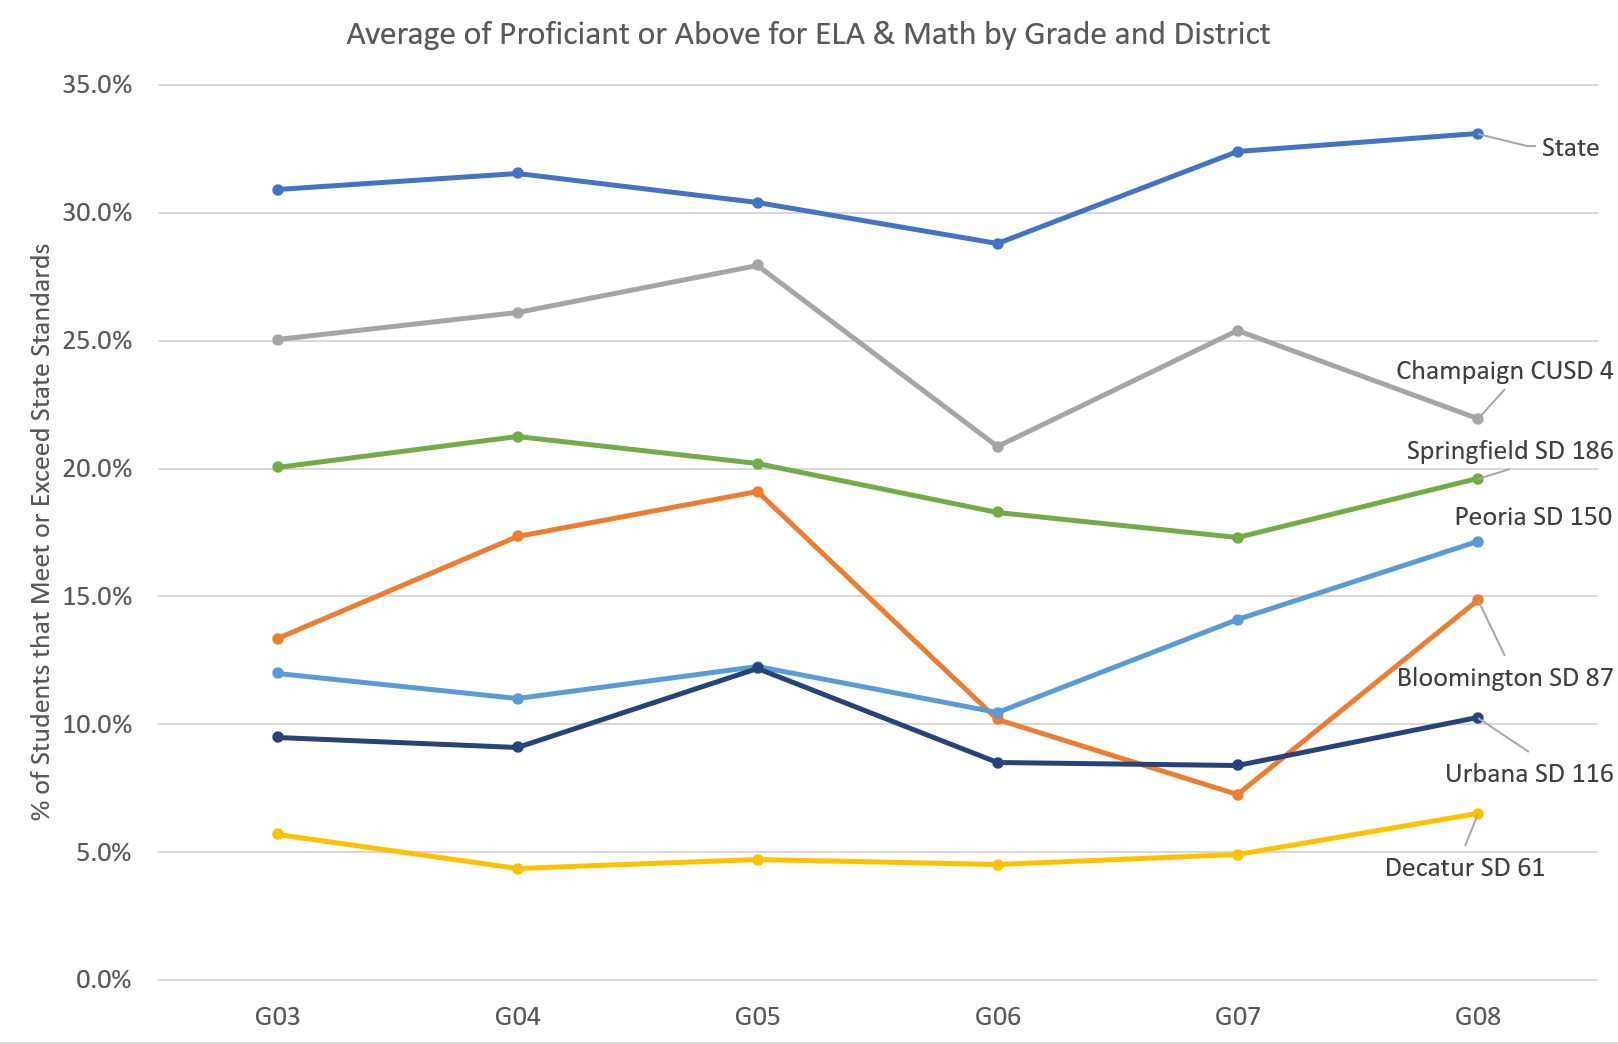
This is the average of grades three through eight ELA and Math test scores for each school district in the state, and the red dot is Decatur2. Of the 754 districts on my chart 75 have a higher percentage of low-income students than Decatur. But of those 75, only 8 have worse test scores. So, 67 of 75 districts have (possibly, and probably) worse projected outcomes, but still performed better, and some far better, than we did in Decatur. It makes me say to Freddie deBoer, “look Freddie, we know we aren’t going to be Naperville, but can’t we at least try to be Peoria?” Not to belabor this point, but here’s the same graph with only a few central Illinois, districts…

Have I got your attention? I see room for improvement, or at least hope for improvement, don’t you? The next thing you have to ask is - will it happen on its own, or do we need to actually do something? Should the community, via the board, drive the process, or should the community expect the professionals in central administration to make sweeping changes to affect outcomes? Duane and I have written extensively about a few immediate changes we would make, and the items on our agenda include:
Create a third-grade reading gate. (articles here, here, and here.)
Move to more homogeneous teaching (reading & math groups, for example). (#1 in this article.)
Ban Cell phones (we’ve written about this ad nauseam - search our archives!)
And move to a single high school (ditto #3)
These are all major changes that need community support, and that support should start with and come from the School Board. There are smart people on the District Leadership Team that can and should make nearly every decision on their own, but to prevent hellfire from raining down on them, they often need the board to show that the community stands behind them. That is what is required for the four items above. And since Duane and I like to think we’re politically savvy, I should point out that items 1, 3, and probably 4 have been supported nationally by both the left and the right. Number two above is tricky, and I’ll talk about this more later, but RTI/individual help/break out groups is the one thing that statistics say works (all the time!). We simply need to start thinking that decisions we make can affect educational outcomes, at least at the margin for heaven’s sake, for the students of District 61.
Where we see a need for change (and/or questions that deserve answers)
Then if we agree that we need to do something, let’s first look at how the individual schools are doing, as that might inform some decisions. Note that for this graph I’m switching from the average of Math and ELA “Meeting Standards and Above” (levels 4 & 5) to “Approaching Standards and Above” (levels 3, 4, & 5). The reason I’m including level 3 is because we’re dealing with a small amount of data and DPS has a few grades where no children met standards. So, since you can’t differentiate between zeros, it’s better to include more levels to allow comparison between schools.

I know this chart is a bit muddled but in the conversation of “what should we do about this” (ideas mentioned above) Duane and I discovered three interesting data related items that should be explored, which I’ll break down in more detail:
Hope Academy
Robertson Charter School
7th Grade Relative Drop
Hope Academy
Hope is the bottom (blue) line in the graph above. I don’t need to tell you how bad those numbers are. They are so much lower than every other school that something must be going on here. We know from the “great covid learning loss” that teachers matter, and while I’d like to accompany the following graph with a chart of the number of full-time teachers at Hope Academy over the last three years, I’ve been assured from good sources that the number has been declining, and the number of substitute days has been rising rapidly.

The state of Illinois and DPS District 61 have been gradually recovering from the Covid learning loss, but Hope has not. If the board wants to dig into this further3, I’d start by looking at the increase in paid substitute days for Hope over the last three years. Here’s the best we could do with publicly available data…
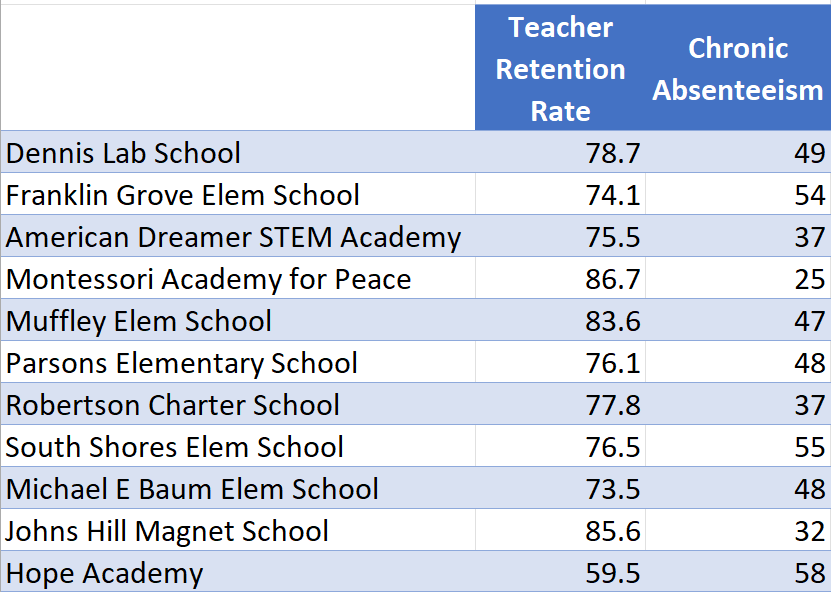
Clearly the teacher retention problem is the worst at Hope. We can throw up our hands and say there’s nothing we can do about this problem. But, since there’s probably only one solution this problem - what about paying teachers at Hope more? The unions would never allow that you’re probably thinking. But something must be done and the only way I think we’ll get even close to adequate teacher coverage is to pay more money at the lowest performing schools. Set up a meeting with the DPS Teacher’s Union now. It’s in their interest more than any other group (except the parents of the kids at Hope) to find a solution to this problem. The number of teachers that have left the district, and obviously and subsequently the union’s ranks must be large. Constructing a pay scale that considers test scores is impossible (if scores improve would you pay less?) but there are other metrics that could be used including percentage low income, absenteeism, etc. that could work instead. I’m sure Duane and I aren’t the first people to think about this – let’s explore ideas that have been implemented and tested in other districts that have dealt with this issue. Now here’s a problem worth researching, don’t you think?
Robertson Charter School
Here’s the 2023 level 3 and above data with only Robertson Charter school, to make it easier to read…
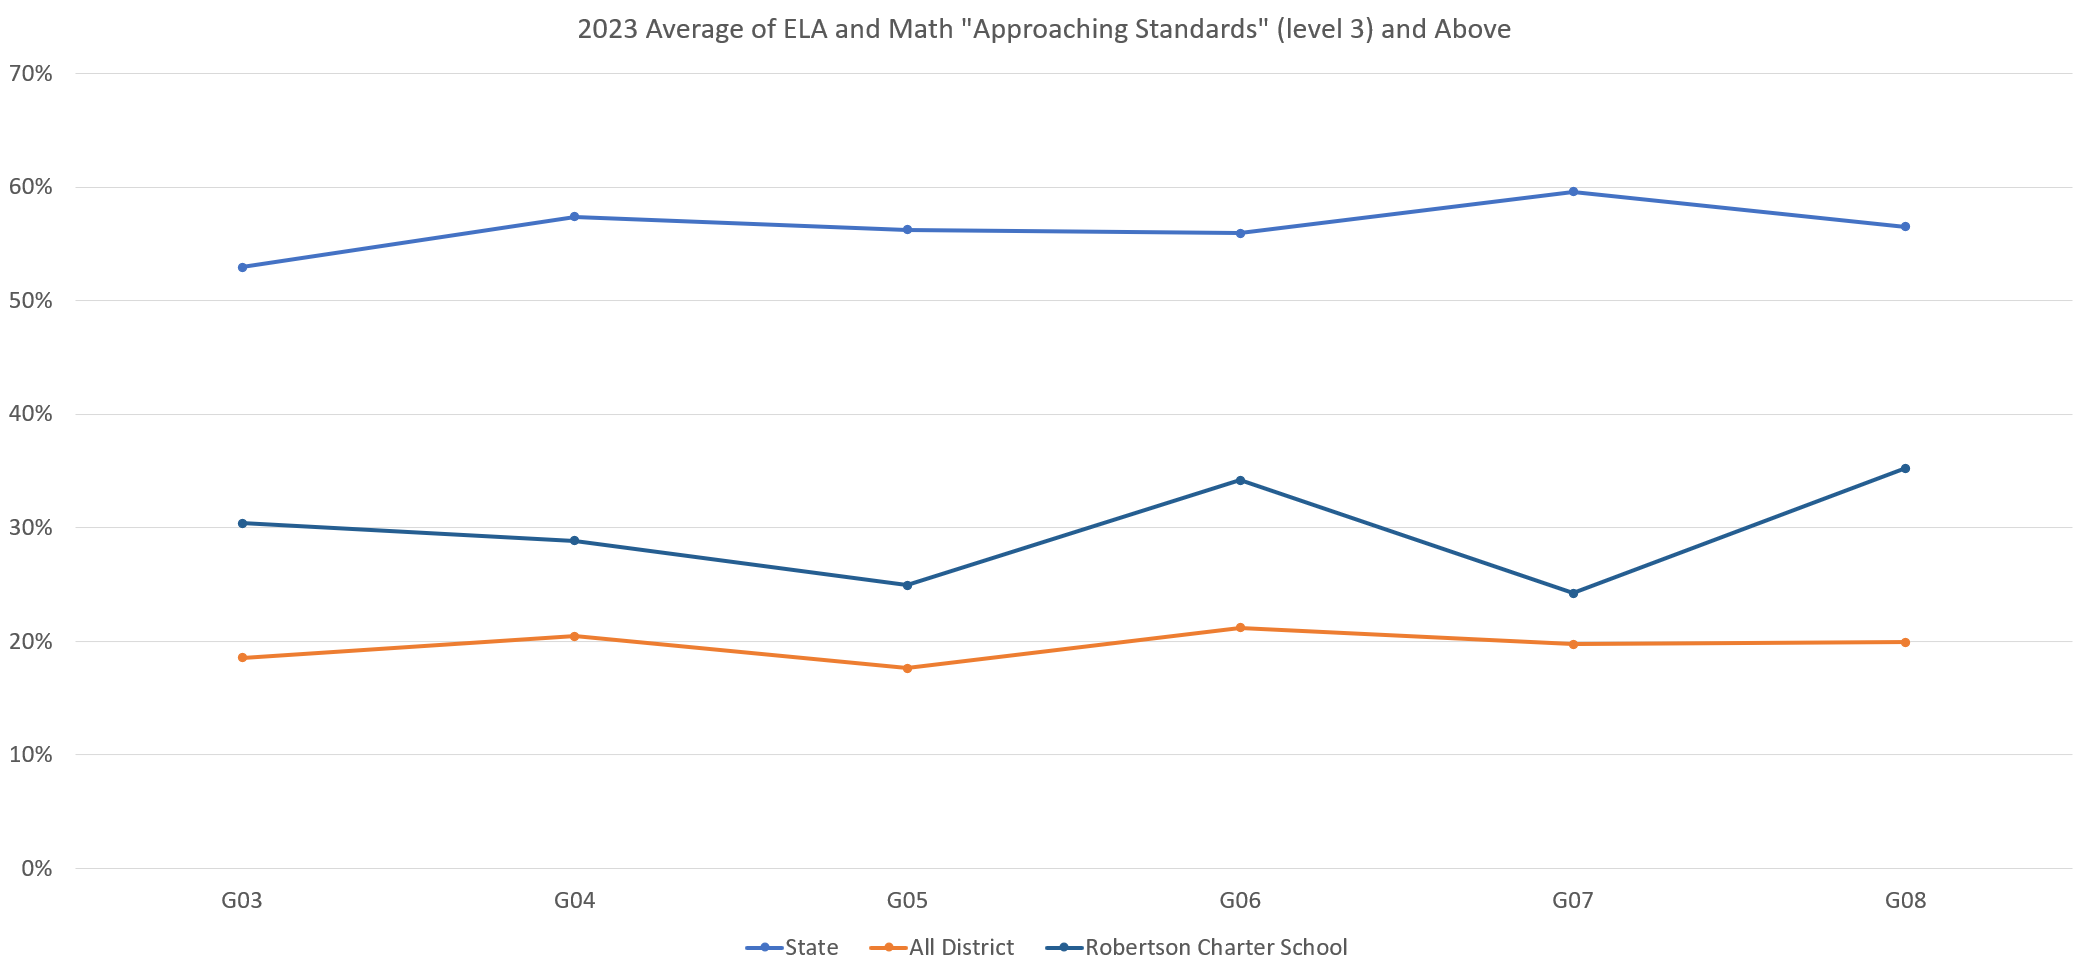
Let’s go Robertson! Robertson has 68.1% low-income students, and the district has 74.6%, so that small difference clearly doesn’t account for the much better test scores at every grade level by Robertson. One teacher at Robertson told us one of the reasons for their continued test score success is their focus on RTI. Thirty minutes of RTI a day in many cases, often I presume focusing on skills that appear on the state mandated tests. Additionally taking practice tests and rewarding students for taking the testing process seriously – showing up prepared and ready – certainly and additionally affect outcomes. I’ve written about RTI, and while I hate to throw out the “we’re spending $2 million on a football field, and we don’t do any RTI in some buildings in grades K-3?” because I’m not sure what side of the football field argument I come down on (maybe a future article?) but I have to believe you can pull almost anyone off the street, pay them $40 per hour and do some kick-ass grade K through three RTI work.
This is one of my favorite topics (and Duane rolls his eyes now each time I repeat myself about this) but bringing up our test scores to where they are at Robertson is what the Beth Nolan led board tried to accomplish –prepare students more like what is done in Charter Schools. I give her and that board a great deal of credit – at least they tried to affect learning in our schools! I imagine they believe success would have been possible if covid hadn’t interrupted their work (or possibly a few other reasons I’ll allude to below), but on the other hand, Duane and I believe they were destined to fail. Fail because:
Charter Schools traditionally accept parents (not students). A parent must agree to follow the rules of the school and so, by definition, you have children with parental involvement. And then if the student fails to follow the rules they can be dismissed from the school. DPS obviously does not have that type of leverage over the parents or the students.
Regarding learning, the Nolan board went in the opposite direction Duane and I propose. We’ve written about this, but that board brought in an Assistant Superintendent to follow an extremely disciplined and rigorous approach where every classroom would be on the literal same page every single day. Alternatively, we believe more learning takes place in homogeneous classrooms where teachers have autonomy to decide what and when topics are discussed.
That extremely disciplined and rigorous approach is what got them in the most trouble. People don’t like working in a situation where “when you have (or you are) a hammer, everything looks like a nail!” Primarily for this reason, failure was inevitable.
The interesting thing is that most people don’t realize, not employees of the district and certainly not members of the current school board, that the most sweeping change to education in Decatur, Illinois over the last twenty years was made, or at least attempted, by the board without a single vote. I could go on about this longer because I think it would make an excellent educational case to be studied, but to me the bottom line now is – at least they tried. They did something.
But, back to Robertson… If they haven’t already, the board via the central office should start by gathering data4 regarding the success of Robertson on the state tests. We have in front of us a relative success story that needs to be analyzed and assessed. Topics that should be explored include:
What are the primary drivers behind Robertson’s success? Perhaps look by grade level comparing teaching methodologies, teaching time spent on RTI, and individual help, and see if there is a common theme of performance vs state and district scores.
And certainly: what are the outcomes of Robertson’s students?
Do they graduate from high school at higher rates?
Are college acceptance rates better?
Is there a difference in SAT scores between Robertson students and other DPS students.
What can DPS learn from Robertson’s test score success? This should be an extremely important conversation the board should start.
The 7th Grade Relative Drop
Besides our overall poor scores, the crazy bad scores at Hope, and the outlier that is Robertson, the other odd thing we noticed in the scores is a relatively poor performance in seventh grade. Because the state IAR test makers are not flawless in creating a test that perfectly assesses a student’s ability at each grade, we can use the state results to guide us in evaluating how well DPS is performing relative to each grade. For example, if DPS was to be 30 percentage points below the 3rd grade scores, then 40 points below 4th grade, but then back to 35 points below 5th grade, it would be easy to say that “something bad is going on in 4th grade”. Perhaps our curriculum is bad, or the teachers are bad, or something. So, here’s the break down by grade. This is what appears to be happening in grade seven…

While none of the scores are good (you already know that), grade 7 takes an interesting drop down sandwiched between grades 6 and 8. I’m not sure what’s going on here. My first thought was that some families pull their kids out of DPS at this point to send them to private or county schools, but it probably wouldn’t make sense to regress back to the mean difference of -37% in eighth grade if several good students left, so I’m a little stymied and would be interested in hearing your theories in the comments below. But, regardless of what the seventh-grade problem is, we’re going to have a chance to make sweeping changes to our middle school program in the next few years when we close one of our high schools. After the closure, we’ll be left with a big, beautiful building that should house our Middle School and I think that will be the perfect time to reimagine what seventh grade should look like in Decatur, Illinois. I think my next article will be on this topic, so if you have any great statistics regarding middle school success, get in touch with me. Let’s reimagine Middle School, perhaps with the new building, that allows kids at a very influential and transitional age to flourish. More later.
From the IASB Foundational Principles of Effective Governance - The constructive use of data is a skill that must be learned. The board should have some understanding of data but will typically require guidance from the staff.
I don’t have the percentage of students that meet or exceed standards for entire districts, rather I have those percentages for each individual grade within the district. So instead of one percentage of students that meet or exceed standards I take the average of all the students in each grade that meet or exceed standards. Unless a district has vastly different numbers of kids in one grade over another, these values should be very close.
From the IASB Foundational Principles of Effective Governance - The board constantly monitors progress toward district ends and compliance with written board policies using data as the basis for assessment.
From the IASB Foundational Principles of Effective Governance - A board that does (or re-does) staff work disempowers the staff. High levels of superintendent and staff accountability require high levels of delegation.
*** One final note - in my charts I incorrectly refer to ISA tests. The tests are the Illinois Assessment of Readiness tests, so the acronym should be IAR!
 | A guest post by
|