Summer School Subterfuge
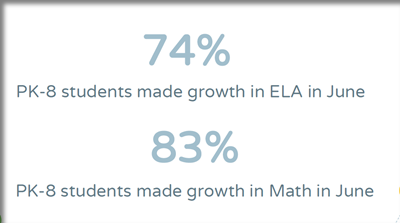
In the August 24 Board Meeting Jeff Dase touted the summer school program as being a success. As evidence he showed the following slides, along with supporting evidence from individual schools. It’s obviously important to analyze this program because it was very expensive, and to determine if we want to repeat it next year.
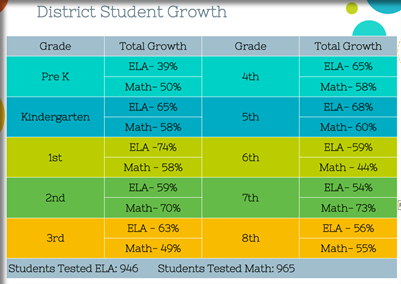
First a little bit about the numbers… Tests were given at the beginning and at the end of summer school to gauge the improvement in ability in Math and English Language Arts. If a student scored at least one point better on the second test this was considered growth. In 4th grade math, for example, the slides show 58% of 4th graders performed better on the second test. Keep in mind this also implies that after 4 weeks of learning 42% of 4th graders did worse on the second test!
We have two major problems with the analysis of the effectiveness of the program.
1. The numbers certainly don’t pass the “eyeball test”. How could Math Growth, for example, be 83% when not one of the individual classes achieved 83% growth? This is mathematically impossible. So, unless we’re missing something, the overall growth (math and ELA combined) must be somewhere between 39% and 74%.
2. The proper way to analyze the scores would be to use the average growth rate per student, including a statistical confidence interval. It would be much more meaningful to say, “we are 95% certain that students on average scored X% better on the second test than the first.”
We (here at The DPS Chalkboard) thought of writing a FOIA request for the raw scores, but frankly we know all the people in the DPS Admin Building are overworked as it is, so we decided to do a simple calculation using the numbers presented and give some real findings.
First, 4 of the 20 class average scores are below 50%! This implies a fifth of the results not only showed no “growth”, but the outcomes were worse after 4 weeks of summer school for an entire class – measured across the district! (How could students get worse?)
Second if we simply use the grade level growth rates presented, we can calculate an average growth rate of 59% with (and don’t get too bogged down in the math) a standard deviation of 0.086. Using these numbers, we can say we are 95% sure somewhere between 55% and 63% of the students performed better on the second test. For our money, and make no mistake – it is our money, this is not enough “growth” to make the curriculum worthwhile.
Next year, we would prefer letting the teachers develop their own curriculum – one that matches the needs of the students and can be implemented cost efficiently.
We welcome comments. They are the fuel for future articles. (However, we reserve the right to delete comments that aren’t productive.)