Fastbridge Score Recap – Fall 2021
Here at DPS Chalkboard we are less interested in test scores than we are with providing each student the opportunity to flourish - providing students at every level the chance to appreciate learning. Unfortunately, that is not the way things work in the United States today, so we’ll report on the big news in local education over the last month…
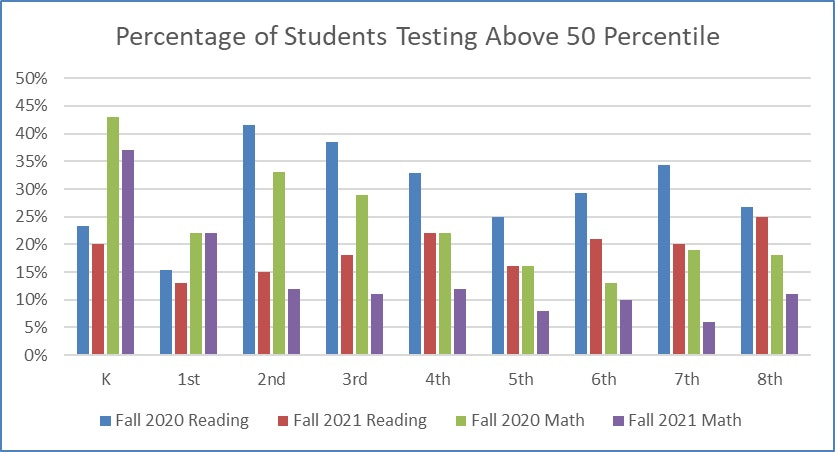
The district uses the FastBridge standardized tests to measure the performance of students in kindergarten through 9th grade. The Decatur Public School administration doesn’t release raw scores, or even year-over-year test increases. Rather the scores released reflect how district students perform relative to other FastBridge test takers statewide. So, with the data provided we can’t be entirely sure if our (absolute) scores are increasing or decreasing, but we do know, possibly more importantly, how the students are performing relative to the rest of the Illinois FastBridge population. Historically from a relative standpoint the results have not been good for the district because year after year less than a third of the students in Decatur score at or above what the average FastBridge test taker in Illinois scores. So, for example if the average score statewide is 50 out of 100, DPS has less than one third of the students who will score a 50 or better.
In the most recent fall 2021 FastBridge scores, Decatur student scores fell even further relative to state scores, falling from 30% meeting the average state score to 20% in Reading and from 24% to 14% in math. This is a major drop from where we were and even though we said we are less interested in test scores; these numbers are too bad to simply brush aside. Before we try to fix the issue, first we must identify the reasons our scores are falling (faster than the state scores).
Here are the four reasons for the relative drop in scores that we came up with:
Because of covid, the number of in person learning days was reduced considerably. This number was reduced statewide, but Decatur Public Schools was virtual more days than most of the districts in the state, and nationwide we are seeing a strong correlation between in-person learning days and test scores.
Families with the means to leave the district took the opportunity to do so over the last two years. There’s a well reported correlation between family income and test scores. There has also been a nationwide exodus from public education over the last two years. Combine these two factors and you have a difficult environment for test score increases.
Teaching to the test – see our article on Teaching to the Test and how we believe this is having a damaging effect on education in Decatur. I won’t repeat all the arguments here, but suffice it to say this methodology creates less individualized learning plans for students and less motivated teachers.
Reduced staff and the current problem with hiring subs, combined with less district wide focus on RTI (Response to Intervention) has made it more difficult for lower students to catch up. Rather than a district wide RTI policy, each elementary building is (apparently) creating their own RTI plans. Is it possible to take the individual experiments each building has created over the last year and by analyzing the scores of RTI students, determine a “best practice” for the district? By looking at the increase (or decrease) of all the RTI students over the last year, we think you might be able to determine which building strategy is most effective.

